Result & Discussion

Optimization of structure formation conditions

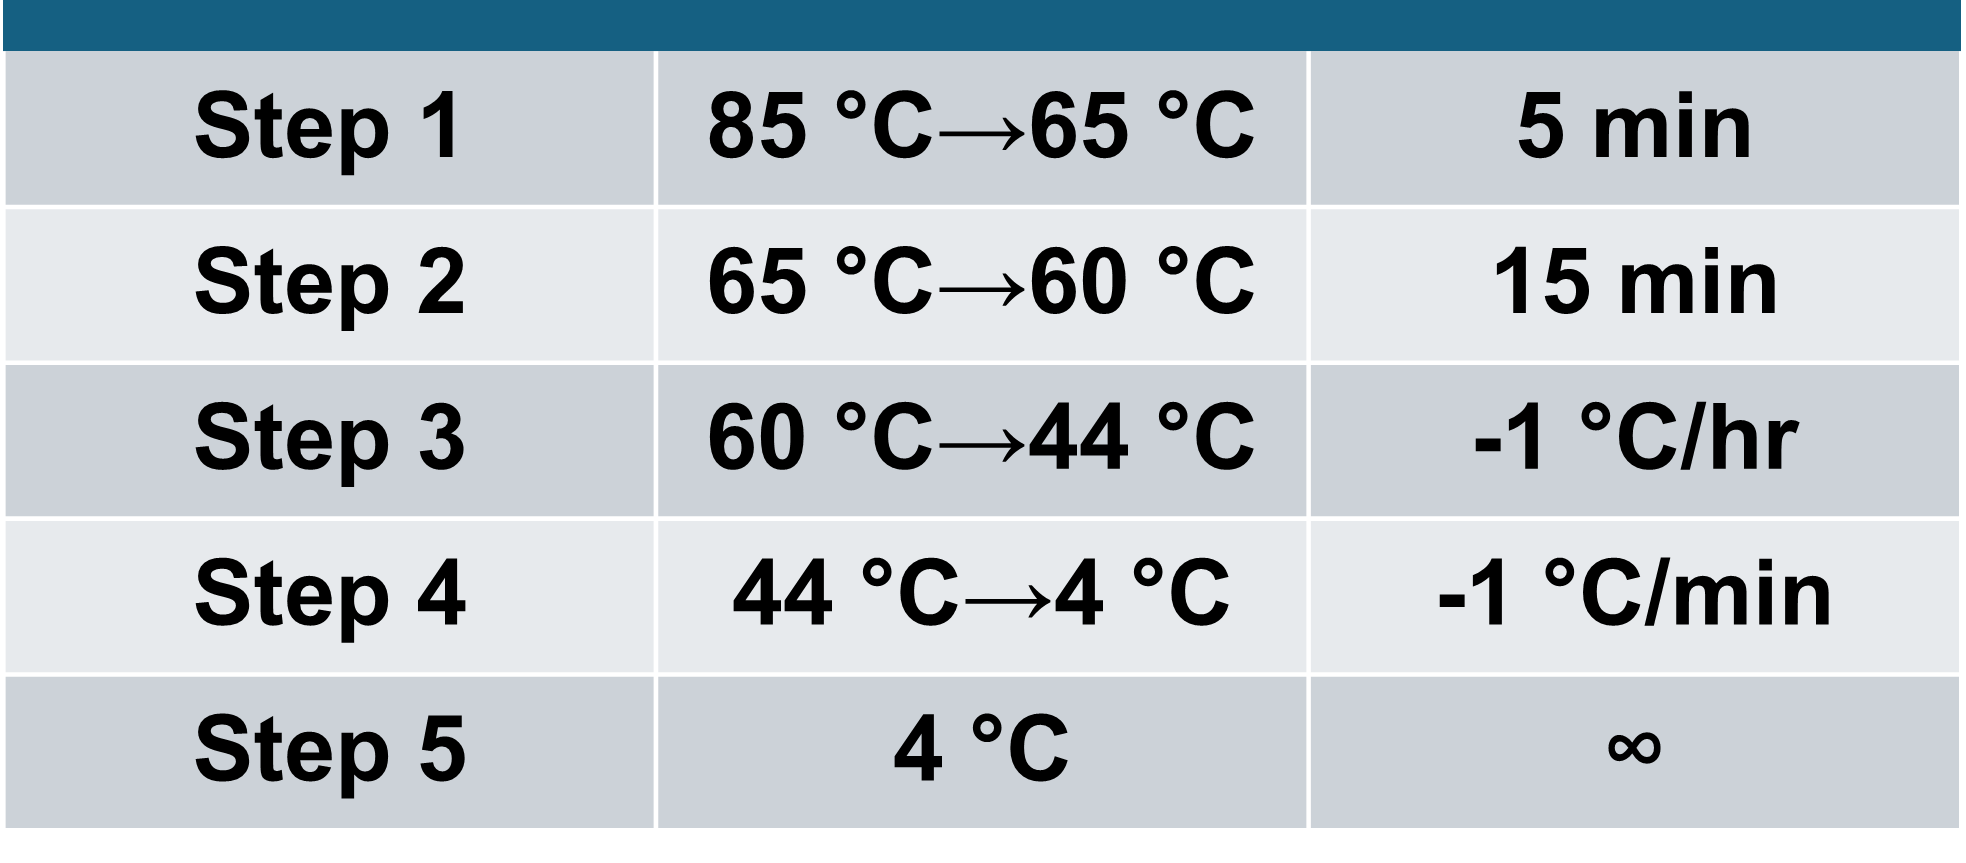
An annealing protocol of 2 hours was initially employed; it was placed at 95 °C for 3 minutes and then lowered by 0.6 °C every minute from 95 °C to 20 °C.

Table 1. Annealing protocol 1: annealing conditions for 2 hours
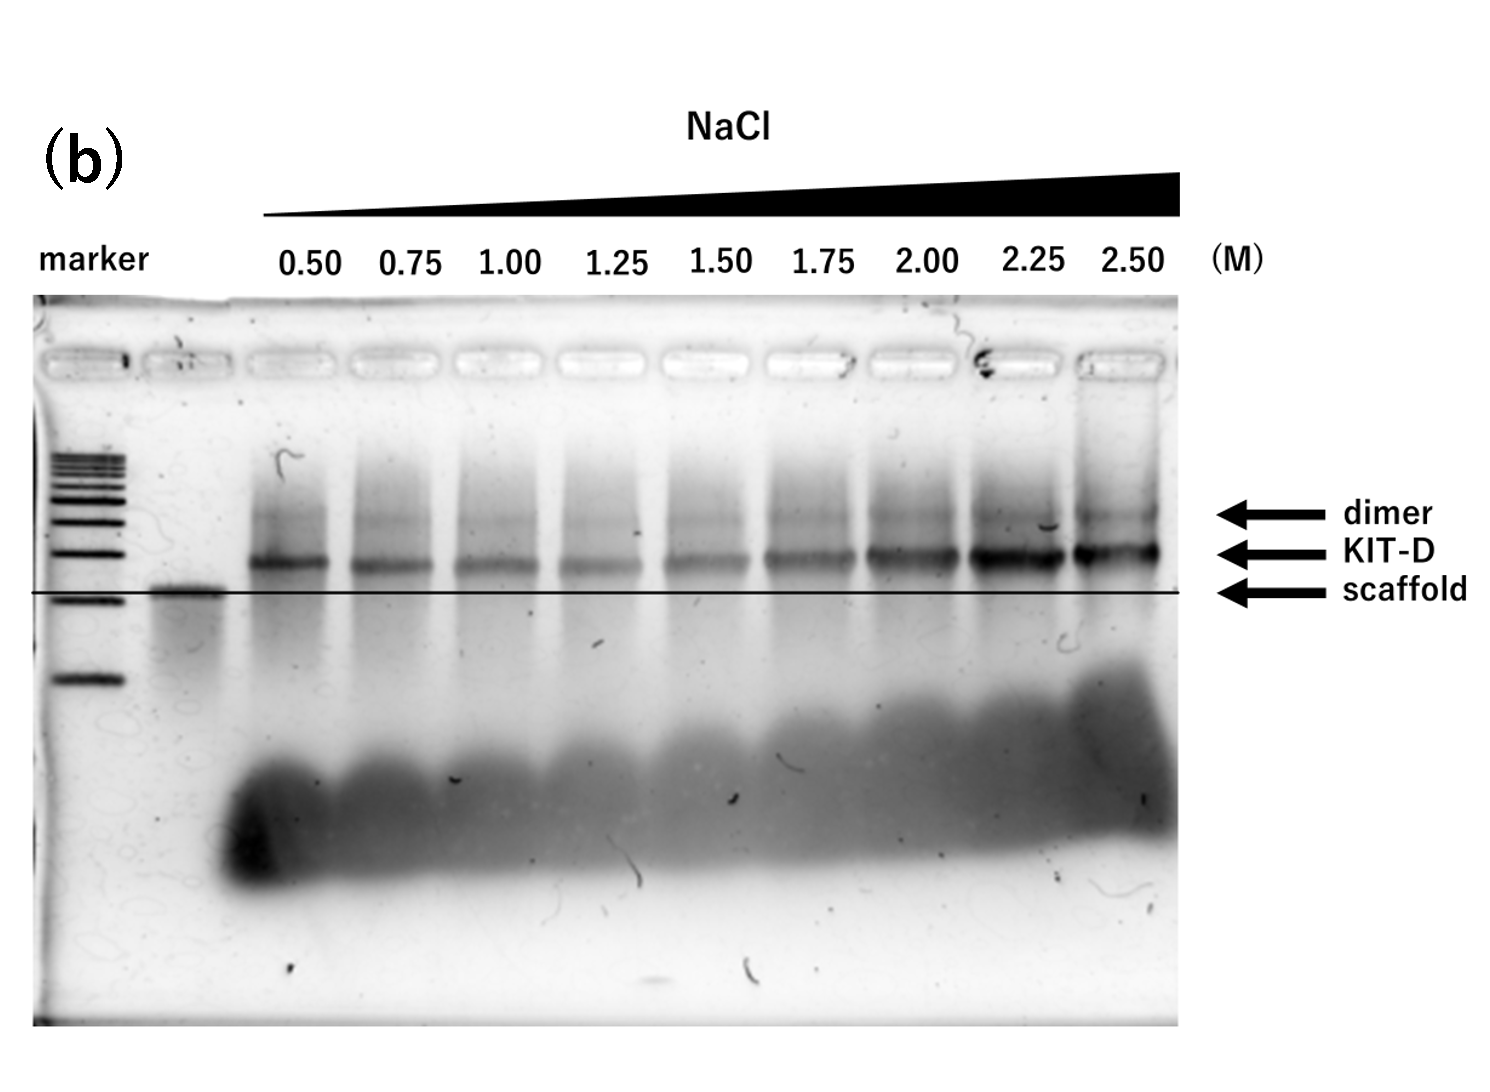
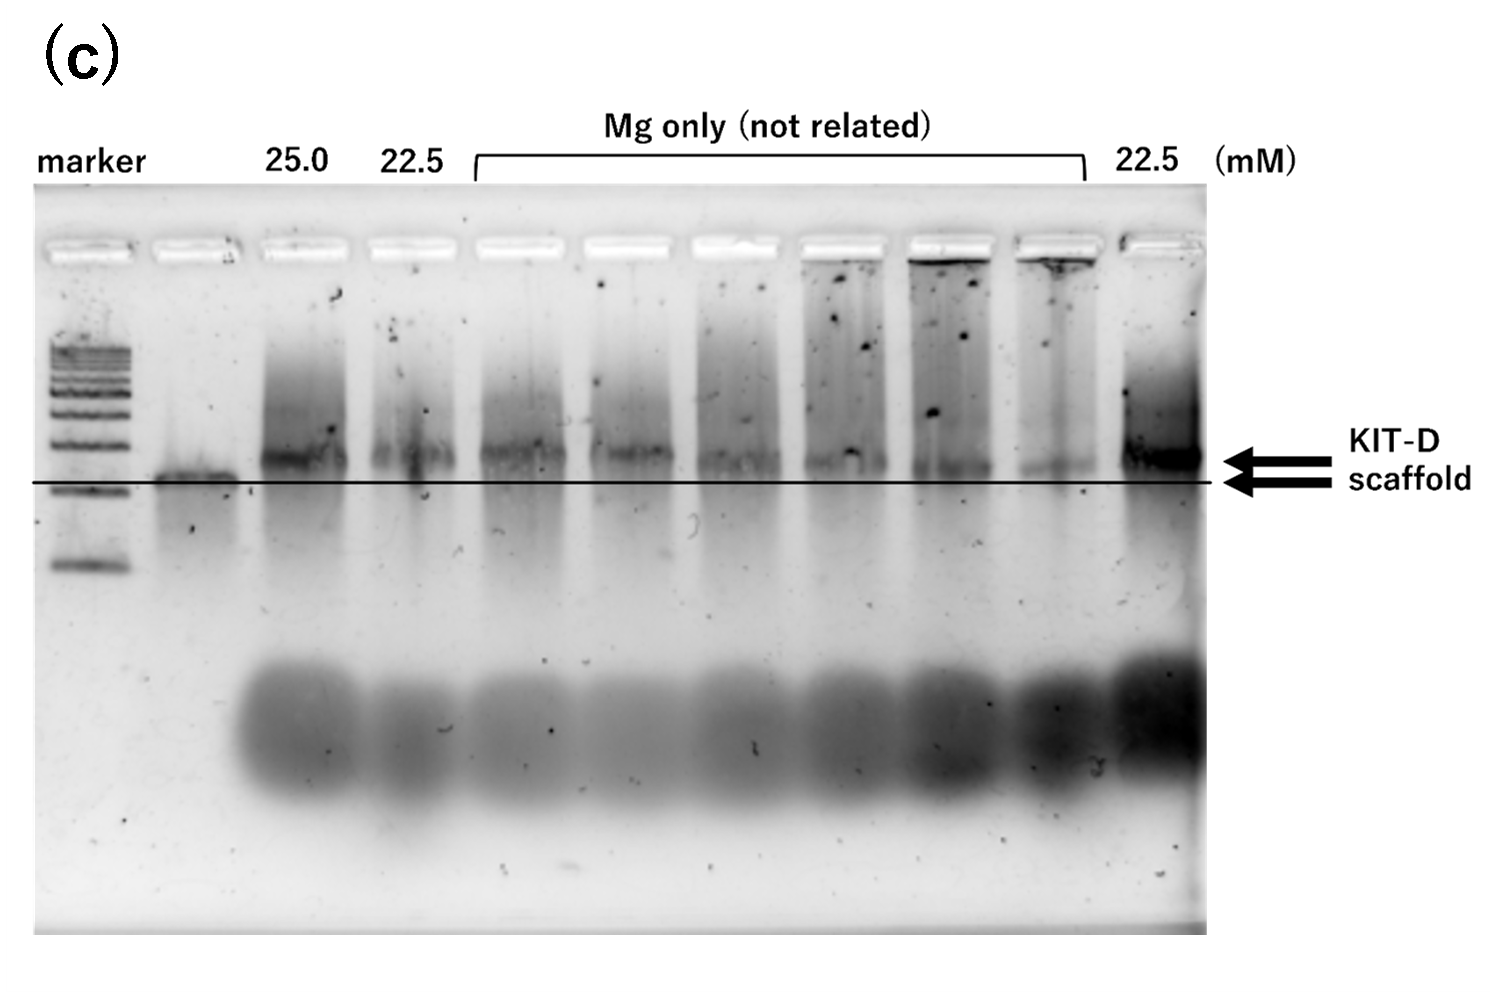
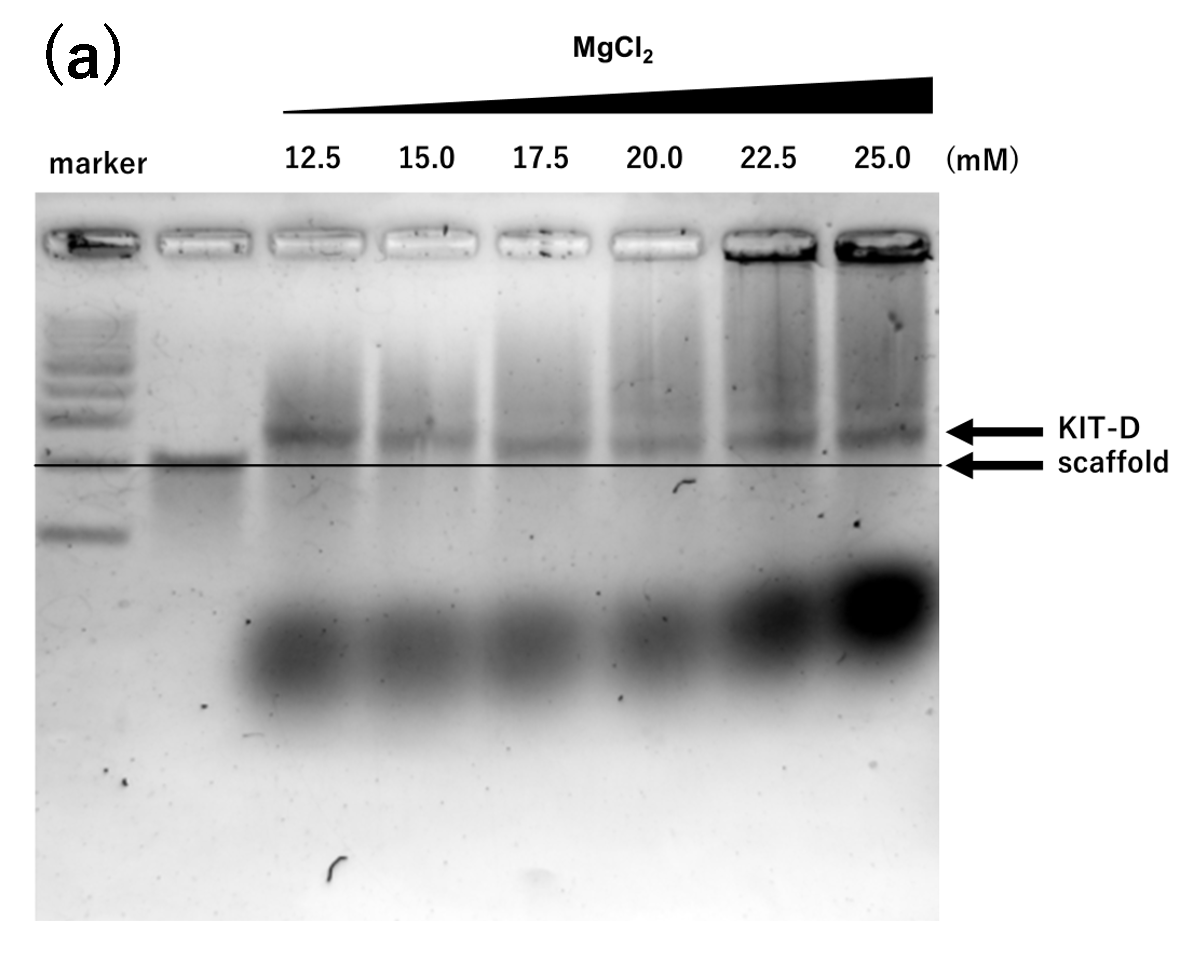
After annealing, the different salt concentrations were compared by agarose electrophoresis. UNTWIST RING-shaped KIT-D was used for the electrophoresis, and it was performed under conditions of 50 V, 120 min, 4 °C. The results of the electrophoresis are shown in Figure 1.

Figure 1. agarose gel electrophoresis of samples annealed for 2 hours

(a) Mg only, 2h, Lane 1: marker, Lane 2: 2 nM scaffold, Lane 3: 12.5 mM, Lane 4: 15.0 mM, Lane 5: 17.5 mM, Lane 6: 20.0 mM, Lane 7: 22.5 mM, Lane 8: 25.0 mM
(b) Na only, 2h, Lane 1: marker, Lane 2: 2 nM scaffold, Lane 3: 0.50 M, Lane 4: 0.75 M, Lane 5: 1.00 M, Lane 6: 1.25 M, Lane 7: 1.50 M, Lane 8: 1.75 M, Lane 9: 2.00 M, Lane 10: 2.25 M, Lane 11: 2.50 M
(c) Na(100 mM) and Mg, 2h, Lane 1: marker, Lane 2: 2 nM scaffold, Lane 3: 25 mM, Lane 4: 22.5 mM, Lane 5~10: Mg only (unrelated), Lane 11: retry of Lane 4

In this annealing method, the bands of the DNA origami structures are located above the bands of the scaffolds. This indicates that staple strands successfully hybridized with the scaffold strands in the 2 hours protocol, although in very low concentrations. Additionally, considering that the smear around the bands for KIT-D was very evident, longer annealing protocols were explored. To find an annealing protocol that may result in a better result, protocol from Team Sendai in 2018 was used as a reference[1].
Table 2. Annealing protocol 2: annealing conditions for 17 hours
After annealing, these samples were subjected to agarose electrophoresis for comparison of different salt concentrations. The UNTWIST RING-shaped KIT-D was also used, at the same conditions as the previous 2 hours annealing protocol, which was 50 V, 120 min, 4 °C. The results of the electrophoresis are shown in Figure 2.

Figure 2. Agarose gel electrophoresis of samples annealed for 17 hours

(a)Na only, 17h, Lane 1: marker, Lane 2: 2 nM scaffold, Lane 3: 0.50 M, Lane 4: 0.75 M, Lane 5: 1.00 M, Lane 6: 1.25 M, Lane 7: 1.50 M, Lane 8: 1.75 M, Lane 9: 2.00 M, Lane 10: 2.25 M, Lane 11: 2.50 M
(b) Mg only or Na(100 mM) and Mg, 17h, Lane 1: marker, Lane 2: 2 nM scaffold, Lane 3: 12.5 mM, Lane 4: 15.0 mM, Lane 5: 17.5 mM, Lane 6: 20.0 mM, Lane 7: 22.5 mM, Lane 8: 25.0 mM, Lane 9: 12.5 mM and Na 100 mM, Lane 10: 15.0 mM and Na 100 mM, Lane 11: 17.5 mM and Na 100 mM, Lane 12: 20.0 mM and Na 100 mM, Lane 13: 22.5 mM and Na 100 mM, Lane 14: 25.0 mM and Na 100 mM

The 17 hours protocol, like the 2 hours protocol, also shows a lot of smears and extra staple strands, but this was possibly due to insufficient purification and the search for an appropriate purification method was underway. However, compared to the electrophoresis results of the 2 hour annealing, that of the 17 hours showed a lot clearer KIT-D bands compared to the smears, which showed that 17 hours of annealing was a better method compared to the 2 hours of annealing.

Confirmation of BELT-shaped KIT-D structure formation

The first step in forming KIT-D was the formation of its BELT-shape. To confirm that KIT-D was formed correctly in its BELT-shape, experiments were performed. The agarose gel electrophoresis results are shown in Figure 3.

Figure 3. Agarose gel electrophoresis for BELT-shaped KIT-D

Lane 1: marker, Lane 2: 2 nM scaffold, Lane 3~6: RING-shaped(unrelated), Lane 7: Mg 20 mM BELT-shaped non-purified, Lane 8: Mg 20mM BELT-shaped purified, Lane 9~10: RING-shaped(unrelated), Lane 11: Mg 22.5 mM and Na 100 mM BELT-shaped non-purified, Lane 12: Mg 22.5 mM and Na 100 mM BELT-shaped purified This electrophoresis result shows that bands for the BELT-shaped KIT-D were located over that of the scaffold, meaning the general size of the structure has increased. It can be inferred that the size of the structure increased as the staples bound to the scaffold by hybridization.

Then, observation using TEM was performed to confirm the formation of the BELT-shaped KIT-D. The observation results are shown in Figure 4.

Figure 4. TEM image of BELT-shaped structure

Figure 4(a) shows a general view of the TEM image that captures a BELT-shaped structure. Figure 4(b) zooms into a structure that shows a long DNA-like structure with a size of about 134.2 nm, very close to that of the designed BELT-shaped KIT-D, which is about 134 nm.

The structure shown in Figure 4 is measured to be about 134.2 nm, which is very close to that of the designed structure. This suggests the likely success in BELT-shaped KIT-D, although more improvement in formation and purification are necessary to obtain a better image.

Evaluating transformation of RING-shaped KIT-D

Then, the RING-shaped KIT-D was evaluated. First, the UNTWIST form of the KIT-D was formed by adding fastening staple strands to the ends of the BELT-shape, thereby rolling up the structure in its RING-shape. Then, additional close strands were introduced to transform the structure into the TWIST state, and both UNTWIST and TWIST forms of RING-shaped KIT-D were first evaluated by agarose gel electrophoresis (Figure 5).

Figure 5. Agarose gel electrophoresis comparing UNTWIST and TWIST KIT-D

This figure shows an agarose gel electrophoresis image of the following samples: Lane 1: marker, Lane 2: 2 nM scaffold, Lane 3: RING-shaped without latch, Na 17.5 M, Lane 4: 9 nt latch UNTWIST, Na 17.5 M, Lane 5: 9 nt latch TWIST, Na 17.5 M, Lane 6: RING-shaped without latch, Mg 20 mM, Lane 7: 9 nt latch UNTWIST, Mg 20 mM, Lane 8: 9 nt latch TWIST, Mg 20 mM, Lane 9: RING-shaped without latch, Mg 22.5 mM and Na 100 mM, Lane 10: 9 nt latch UNTWIST, Mg 22.5 mM and Na 100 mM, Lane 11: 9 nt latch TWIST, Mg 22.5 mM and Na 100 mM, Lane 12: 12 nt latch UNTWIST, Mg 22.5 mM and Na 100 mM, Lane 13: 12 nt latch TWIST, Mg 22.5 mM and Na 100 mM, Lane 14: 15 nt latch UNTWIST, Mg 22.5 mM and Na 100 mM, Lane 15: 15 nt latch TWIST, Mg 22.5 mM and Na 100 mM, Lane 16: 21 nt latch UNTWIST, Mg 22.5 mM and Na 100 mM, Lane 17: 21 nt latch TWIST, Mg 22.5 mM and Na 100 mM

From Figure 5, it can be suggested that it is likely to form aggregations in lower salt concentrations and with low and high salt concentrations, bold dimer bands can be observed. Also, bands of TWIST structures are located slightly lower than the UNTWIST structures in most samples, suggesting that closed structures have smaller structural size. This is an ideal result for KIT-D, since when the structure is in its TWIST state, it is assumed for the structure to fold in, resulting in smaller structural size.

To compare the difference between UNTWIST and TWIST structures, TEM imaging was used to compare samples with open and closed states. Since the AGE result did not show significant difference between samples using a mix of Mg and Na, concentration of Mg 22.5 mM was selected. Also, at this time, the analysis of simulation results were complete, suggesting that the structure of the 21-base long latch to be used in the experiments. The results are shown in Figure 6.

Figure 6. TEM image comparing UNTWIST and TWIST structures

(a)TEM image Mg 22.5 mM and Na 100 mM, UNTWIST KIT-D with latch 21 nt long,
(b)zoomed image of (a), (c)TEM image of Mg 22.5 mM and Na 100 mM, UNTWIST KIT-D with latch 21 nt long

From Figure 6, there is clearly less aggregation with the TWIST structures, as well as structures forming dimers. The average internal area for ten structures of the UNTWIST form of the RING-shaped KIT-D was calculated to be about 528.8 nm², while the average internal area of ten structures of the TWIST form of the RING-shaped KIT-D was calculated to be about 396.5 nm². The experimental decrease in the internal area by transformation was 25 %. However, further analysis and verification is required for clearer and reproducible results.
Reference
[1]Team Sendai 2018. “DNA Transfolder | TeamSendai 2018.” Bitbucket.io, 2018, biomodteamsendai2018.bitbucket.io/wiki/design.html. Accessed 15 Nov. 2024.